Hedge Ratio: Complete Guide to Risk Management
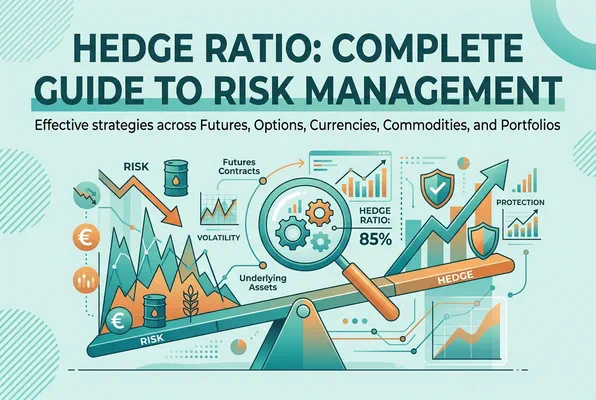

Protecting a portfolio from adverse market moves is one of the most critical skills in finance. Whether you are a commodity producer locking in prices, a fund manager neutralizing currency exposure, or a retail trader protecting stock positions, your effectiveness hinges on one core concept: the hedge ratio.
Getting this number right is the difference between a hedge that genuinely reduces risk and one that leaves you over-exposed, or even creates new, unintended risks. This guide will walk you through everything you need to know, from the fundamental definition to advanced calculation methods and real-world applications.
What Is a Hedge Ratio?
The hedge ratio is a measure that compares the value of a hedging position to the total size of the exposure being hedged. In simpler terms, it tells you what fraction of your risk you are actually covering.
Expressed as a number between 0 and 1 (or as a percentage between 0% and 100%), it answers the question: “For every unit of risk I hold, how much of it is offset by my hedging instrument?”
- A hedge ratio of 1 (or 100%) indicates a perfect hedge, where every dollar of risk is covered by an equal and opposite position.
- A hedge ratio of 0.5 (or 50%) means half of the exposure is hedged.
- A hedge ratio of 0 means no hedge is in place at all.
It is important to understand that a perfect hedge is rarely achievable or even desirable. Costs, imperfect correlations between assets, and strategic portfolio considerations all mean that most real-world hedges are partial.
Understanding the Hedge Ratio: From Theory to Practical Risk Protection
A key part of understanding the hedge ratio is recognizing that it is more than a mathematical calculation, it is a practical risk management ratio used as a risk control tool across financial markets. The hedge ratio measures the percentage of a hedging instrument relative to the total position, allowing investors to see how much of a position is protected against adverse price movements. In simple terms, the hedage ratio tells market participants whether they can fully hedge an exposure or whether a smaller hedge provides a more suitable balance between risk protection and return potential. This guide on hedge ratio shows how the ratio helps investors make informed decisions by evaluating the comparative value of an open position against the selected hedging asset, ultimately improving the role in managing overall investment risk.
Why the Hedge Ratio Matters
Without calculating the hedge ratio, you are guessing at your risk coverage. Consider a wheat farmer who sells futures contracts to lock in a price before harvest. If the futures contract size does not perfectly match the quantity of wheat being produced, the farmer is either over-hedged or under-hedged. Both situations carry risk.
The hedge ratio provides a systematic, mathematical framework to determine the appropriate size of a hedging position, removing guesswork from risk management decisions.
Core Types of Hedge Ratios
Not all hedges are constructed the same way. Depending on the instruments used and the market context, different types of hedge ratios apply.
The Minimum Variance Hedge Ratio
The minimum variance hedge ratio (MVHR) is considered the gold standard for futures-based hedging. Its goal is to find the hedge size that minimizes the statistical variance, and therefore the volatility, of the overall hedged position.
The formula is:
h* = ρ × (σS / σF)
Where: - h = the optimal (minimum variance) hedge ratio - ρ = the correlation coefficient between changes in the spot price and the futures price - σS = the standard deviation of changes in the spot price - σF* = the standard deviation of changes in the futures price
This formula has a powerful intuition. If the spot and futures prices move in perfect lockstep (ρ = 1) and have identical volatility (σS = σF), then h* = 1 and a full hedge is optimal. But if the correlation is lower or the volatilities differ, a different proportion is needed.
Example: A portfolio manager holds a position in a mid-cap equity index. She wants to hedge using futures on a large-cap index (which is not a perfect match). She calculates: - Correlation (ρ) = 0.85 - Standard deviation of spot changes (σS) = 2.2% - Standard deviation of futures changes (σF) = 1.9%
h* = 0.85 × (2.2 / 1.9) = 0.85 × 1.158 ≈ 0.98
She should hedge approximately 98% of her portfolio’s value using the large-cap futures contract.
The Delta Hedge Ratio
In the world of options trading, the delta serves as the hedge ratio. Delta measures the sensitivity of an option’s price to a one-unit change in the price of the underlying asset.
- A call option with a delta of 0.6 means the option’s price increases by $0.60 for every $1 rise in the underlying stock.
- A put option with a delta of -0.4 means the option’s price falls by $0.40 for every $1 rise in the underlying stock.
To construct a delta-neutral hedge, one that is insensitive to small price movements, a trader must hold a position in the underlying asset that offsets the total delta of their options portfolio. This is known as delta hedging.
Because delta changes constantly as the underlying price moves and as time passes (a phenomenon related to the option’s “gamma”), delta hedges require frequent rebalancing. This dynamic process is called delta-neutral rebalancing and is central to options market-making.
Cross Hedge Ratio
A cross hedge occurs when you cannot use a perfectly correlated instrument to hedge your exposure. For example, an airline wanting to hedge jet fuel costs might use crude oil futures, as no standardized jet fuel futures market exists with sufficient liquidity.
In this case, the hedge ratio must account for the imperfect relationship between the two assets. The minimum variance formula applies here as well, using historical price data to estimate the correlation and volatility relationship. The lower the correlation, the less effective the cross hedge will be, a concept known as basis risk.
How to Calculate the Number of Contracts
Knowing the hedge ratio is just the first step. The practical application involves calculating exactly how many futures or options contracts are needed to achieve that ratio.
Choosing the Right Hedge for Different Asset Classes
The hedge ratio is important because every financial asset, asset or liability, and market exposure behaves differently. In foreign exchange (FX) markets, companies may hedge exposures in currencies such as GBP or AUD, while equity and commodity investors often rely on futures or options. The hedge ratio formula is used to determine the optimal number of contracts required to hedge a position, taking into account the position’s value, market volatility, and contract specifications. The minimum-variance hedge ratio specifically aims to minimize the variance of the combined portfolio and helps determine the optimal number of futures contracts needed to effectively hedge an exposure without creating unnecessary over-hedging.
Futures Contract Calculation
The standard formula for determining the number of futures contracts (N) needed is:
N = (h* × Portfolio Value) / (Futures Price × Contract Size)
Example: An equity fund manager wants to hedge a $10 million portfolio of S&P 500 stocks. - Minimum variance hedge ratio (h*) = 0.95 - Current S&P 500 futures price = 5,000 - Contract size = $250 per index point (one standard S&P 500 futures contract = 5,000 × $250 = $1,250,000)
N = (0.95 × $10,000,000) / $1,250,000 = $9,500,000 / $1,250,000 ≈ 7.6
Rounding to the nearest whole number, the manager should short 8 S&P 500 futures contracts.
Adjusting for Beta
For equity portfolios, the hedge ratio is often adjusted for the portfolio’s beta, its sensitivity to broad market movements. A high-beta portfolio requires more futures contracts to hedge the same dollar value than a low-beta portfolio.
The adjusted formula becomes:
N = (β × Portfolio Value) / (Futures Price × Contract Size)
Where β is the portfolio beta relative to the futures index. If the fund manager’s portfolio has a beta of 1.2 instead of the assumed 1.0, she would need approximately 9-10 contracts rather than 8 to achieve the same level of protection.
Basis Risk: The Hidden Challenge in Hedging
No discussion of hedge ratios is complete without addressing basis risk, arguably the most important practical limitation of any hedging strategy.
Basis is defined as the difference between the spot price of an asset and the futures price of the hedging instrument:
Basis = Spot Price − Futures Price
Basis risk is the uncertainty that this gap will change in unexpected ways before the hedge is lifted. It arises from several sources:
- Asset mismatch: The underlying asset and the futures contract are not identical (e.g., cross hedging jet fuel with crude oil).
- Timing mismatch: The hedge expiry date does not perfectly align with when the risk resolves.
- Geographic differences: Commodity prices can vary by location, while futures contracts reference a standardized delivery point.
Even a theoretically optimal hedge ratio cannot eliminate basis risk. This is why the minimum variance hedge ratio minimizes, but does not eradicate, portfolio variance.
Managing Basis Risk
- Select the most correlated instrument available. Higher correlation means lower basis risk.
- Match expiry dates as closely as possible to reduce timing mismatch.
- Monitor and adjust the hedge as market conditions evolve.
- Stack and roll strategies can help manage basis risk when long-dated futures are illiquid.
Hedge Ratio in Practice: Real-World Applications
Understanding the theory is essential, but the hedge ratio’s true value emerges in practical application across different asset classes.
Currency Hedging
Multinational corporations and international investors routinely face foreign exchange risk. A U.S. company expecting €5 million in revenues in six months might use EUR/USD forward contracts to lock in the exchange rate.
The hedge ratio in this context determines what proportion of the €5 million exposure to cover. A full hedge (ratio = 1) eliminates currency risk but also removes any potential benefit if the euro strengthens. Many treasury teams opt for a strategic partial hedge, typically between 50% and 75%—to balance protection and opportunity.
Commodity Hedging
Airlines, shipping companies, food manufacturers, and energy producers all use commodity futures to manage input cost risk. The minimum variance hedge ratio is particularly important here because the available futures contracts may not perfectly match the specific grade, location, or timing of the physical commodity they need.
Fixed Income and Interest Rate Hedging
Bond portfolio managers use interest rate futures or swaps to manage duration risk, the sensitivity of bond prices to interest rate changes. The hedge ratio in this context is derived from the duration and dollar value of a basis point (DV01) of both the portfolio and the hedging instrument.
DV01-based Hedge Ratio = DV01 of Portfolio / DV01 of Futures Contract
This ensures that a given change in interest rates produces offsetting gains and losses across the position and the hedge.
Equity Portfolio Protection
Portfolio managers frequently use index futures or put options to protect against broad market downturns. The beta-adjusted hedge ratio ensures the hedge is correctly sized relative to the portfolio’s actual market sensitivity, preventing both over-hedging and under-hedging.
Dynamic vs. Static Hedging
One of the key strategic decisions in hedging is whether to use a static or dynamic approach.
Static Hedging
A static hedge is set up once and left in place until the risk exposure expires or is resolved. It is simpler, cheaper (fewer transaction costs), and requires less active management. However, as the underlying position and market conditions evolve, the hedge ratio can drift away from its optimal value.
Static hedging works well when: - The time horizon is short. - Transaction costs are high relative to the potential benefit of rebalancing. - The correlation between the spot and futures is stable.
Dynamic Hedging
Dynamic hedging involves continuously adjusting the hedge as market conditions change. Delta hedging is inherently dynamic, as an option’s delta changes with price movements and time decay, the hedger must buy and sell the underlying asset to maintain neutrality.
Dynamic strategies offer more precise risk control but come with: - Higher transaction costs from frequent rebalancing. - Operational complexity and the need for sophisticated monitoring systems. - Gamma risk—the risk that rapid price movements require large, costly adjustments.
Common Mistakes When Using Hedge Ratios
Even experienced practitioners make errors when designing and implementing hedges. Here are the most common pitfalls to avoid.
Over-Hedging
Setting a hedge ratio greater than 1 means you have more exposure on the hedging side than on the original position. This effectively reverses your risk, you now profit when prices move against your original position and lose when they move in your favor. This is rarely intentional for risk management purposes.
Ignoring Correlation Instability
The minimum variance hedge ratio relies on historical correlations remaining stable. During market stress, precisely when protection is most needed, correlations often break down. A hedge that performed well in calm markets may offer far less protection during a crisis.
Neglecting to Rebalance
Market movements change the relative values of your position and your hedge. A hedge ratio that was optimal last month may be significantly off today. Regular review and rebalancing are essential.
Focusing Only on Price Risk
Hedge ratios address price risk, but they do not automatically account for liquidity risk, counterparty risk, or rollover risk (the cost and risk of rolling a futures contract forward as it approaches expiration). A comprehensive risk management strategy must consider all of these dimensions.
Tools and Technology for Hedge Ratio Management
Modern portfolio management platforms have made hedge ratio calculation and monitoring significantly more accessible. Tools like finflexia.app allow investors and portfolio managers to:
- Calculate optimal hedge ratios across multiple asset classes.
- Monitor the effectiveness of existing hedges in real time.
- Run scenario analyses to understand how different hedge ratios perform under various market conditions.
- Automate alerts when hedge ratios drift outside acceptable ranges.
The ability to visualize and track hedge effectiveness dynamically removes much of the manual burden from risk management, allowing practitioners to focus on strategic decisions rather than spreadsheet calculations.
Evaluating Hedge Effectiveness
Implementing a hedge is only the beginning. Ongoing evaluation of its effectiveness is critical to ensuring it continues to serve its intended purpose.
Hedge Effectiveness Ratio
The hedge effectiveness ratio measures how well a hedging instrument offsets changes in the value of the hedged position. It is typically expressed as:
Hedge Effectiveness = 1 − (Variance of Hedged Position / Variance of Unhedged Position)
A hedge effectiveness of 0.90 means the hedge has reduced variance by 90% compared to the unhedged exposure. Under accounting standards such as IFRS 9 and ASC 815, hedge effectiveness must be regularly tested and documented to qualify for hedge accounting treatment.
Key Performance Metrics to Monitor
- Realized vs. expected hedge ratio: Has the actual hedge performance matched the theoretical expectation?
- Basis tracking: How has the basis evolved since the hedge was initiated?
- Cost of carry: What are the cumulative costs (margin, financing, roll costs) of maintaining the hedging position?
- Correlation drift: Is the relationship between the hedged position and the instrument as stable as assumed?
Using Hedge Ratios to Improve Investment Decisions
Beyond day-to-day trading, the hedge ratio helps investors incorporate risk mitigation into long-term portfolio management and strategic investment decisions. Whether exploring different derivative products, managing a short position, or protecting the position that is protected against adverse market moves, the ratio provides a structured framework for evaluating hedge effectiveness. Understanding how to calculate the hedge ratio allows investors to monitor whether the position is protected as market conditions change and to adjust exposures when necessary. As a result, the hedge ratio is also a valuable decision-making tool for portfolio managers seeking greater protection while preserving flexibility, making it an essential concept for anyone looking to manage risk efficiently.
Summary: Key Takeaways
The hedge ratio is a foundational concept in risk management that quantifies the proportion of an exposure being offset by a hedging instrument. Mastering it involves understanding several interconnected ideas:
- The minimum variance hedge ratio uses correlation and volatility data to find the statistically optimal hedge size.
- Delta is the relevant hedge ratio for options-based strategies and requires dynamic management.
- Basis risk means no hedge is perfect, even an optimally calculated ratio carries residual uncertainty.
- The number of contracts is derived from the hedge ratio, portfolio value, and contract specifications.
- Dynamic hedging offers precision but at the cost of higher transaction expenses and operational complexity.
- Regular rebalancing and effectiveness monitoring are essential to keeping a hedge aligned with its intended purpose.
Whether you are hedging a commodity exposure, a currency risk, or an equity portfolio, the hedge ratio is your compass. Used correctly, it transforms risk management from an art form into a disciplined, data-driven process, one that protects value without unnecessarily sacrificing returns.

Written by
Dominik KonoldFounder
Dominik is the founder of Finflexia and an expert in treasury accounting, financial instrument valuation and IFRS compliance. Since 2016, he's been a certified Professional Risk Manager (PRMIA) and also lectures for the Association of Public Banks and the Academy of International Accounting. He built Finflexia to help treasury teams automate complex accounting workflows.
Related Posts
Debit Valuation Adjustment (DVA): Understanding Valuation Adjustments
This comprehensive guide explains debit valuation adjustments (DVA), valuation adjustments, credit risk, CVA, derivative pricing, and practical risk management strategies for financial institutions.
What Is CVA? Understanding Credit Valuation Adjustment and Counterparty Risk
This guide explains how Credit Valuation Adjustment (CVA) prices, hedges, and regulates the risk that a derivatives counterparty defaults.
IFRS 9 vs. IAS 39: Key Differences Explained
This article explores the key differences between IAS 39 and IFRS 9, focusing on classification, impairment, hedge accounting, and the practical impact of the transition on financial reporting.
Ready to simplify your treasury accounting?
See how Finflexia helps you manage financial instruments with ease. Book a demo to learn more.
Book a Demo