Expected Credit Loss: A Complete Guide to the Current Expected Credit Loss Model
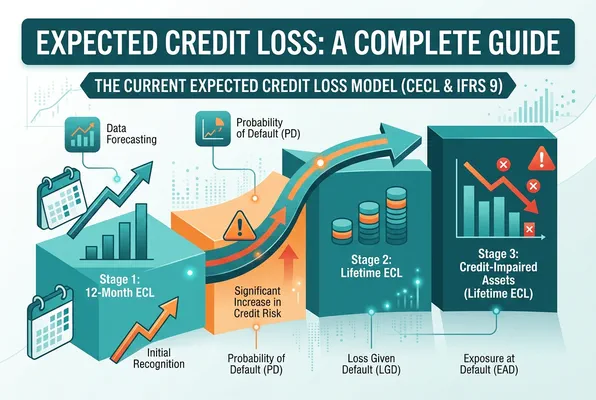

Expected credit loss has fundamentally transformed how financial institutions think about risk. Gone are the days of waiting for a loan to sour before recognizing a problem. Today, under IFRS 9 and its US counterpart CECL, banks, credit unions, and other lending organizations must take a proactive, forward-looking stance, recognizing the possibility of loss from the very moment a financial instrument is originated.
This guide is designed to demystify expected credit loss: what it means, how it is calculated, what challenges practitioners face, and how modern technology is making compliance more achievable than ever.
What Is Expected Credit Loss?
Expected credit loss (ECL) is an accounting and risk management concept that quantifies the probability-weighted estimate of credit losses on a financial instrument over a defined time horizon. Rather than waiting for a loss to materialize, ECL frameworks require institutions to estimate, and recognize, losses in advance.
This represents a fundamental shift from the older incurred loss model, which only recognized impairment after objective evidence of a credit event (such as a missed payment or default) had occurred. Critics long argued that this approach was too reactive, contributing to the delayed recognition of losses during the 2008 global financial crisis and amplifying its severity.
The ECL model addresses this by demanding that financial institutions:
- Consider historical data, current conditions, and forward-looking macroeconomic forecasts
- Recognize impairment allowances earlier in the credit lifecycle
- Continuously reassess credit risk and adjust provisions accordingly
The Regulatory Frameworks Driving ECL
Two primary standards govern expected credit loss recognition globally:
- IFRS 9 – Financial Instruments: Issued by the International Accounting Standards Board (IASB), this standard is used across Europe, Asia-Pacific, and many other jurisdictions.
- CECL (Current Expected Credit Loss): The US-specific framework established by the Financial Accounting Standards Board (FASB) under ASC 326, applicable to US GAAP entities.
While the two share the forward-looking philosophy, they differ in significant ways, most notably, CECL requires lifetime ECL recognition for all assets from day one, whereas IFRS 9 uses a three-stage approach.
The Three-Stage IFRS 9 ECL Model
One of the most distinctive features of IFRS 9 is its three-stage impairment model, which ties the measurement of expected credit loss to changes in credit risk since initial recognition.
Stage 1: Initial Recognition (12-Month ECL)
When a financial asset is first recognized, it enters Stage 1—assuming no significant credit risk concerns exist at origination. In Stage 1:
- The institution recognizes a 12-month ECL (i.e., the expected loss from default events possible within the next 12 months)
- Interest revenue is calculated on the gross carrying amount
- This stage applies to the vast majority of a typical loan portfolio
Stage 2: Significant Increase in Credit Risk (Lifetime ECL)
If credit risk has significantly increased since origination, even if no default has yet occurred, the asset moves to Stage 2. The key changes are:
- The loss allowance increases to lifetime ECL (covering all possible default events over the instrument’s remaining life)
- Interest revenue is still calculated on the gross carrying amount
- The transfer trigger is typically assessed using borrower-level indicators such as credit rating downgrades, significant payment delays, or adverse macroeconomic exposures
The definition of “significant increase in credit risk” is a major area of judgment and ongoing regulatory scrutiny.
Stage 3: Credit-Impaired Assets (Lifetime ECL)
Assets move to Stage 3 when they are considered credit-impaired, meaning objective evidence of impairment exists (for example, a borrower has defaulted or is experiencing severe financial difficulty). In Stage 3:
- Lifetime ECL continues to be recognized
- Interest revenue is calculated on the net carrying amount (gross amount minus the loss allowance)
- Provisioning requirements are at their highest
Core Components of the ECL Calculation
Calculating expected credit loss requires three fundamental building blocks, collectively known as the PD-LGD-EAD framework:
Data, Forecasting, and Credit Risk Management
Reliable loss estimates depend on more than historical performance alone. Modern credit risk management combines historical loss data, borrower-level credit scoring, portfolio segmentation, and forecasts of future economic conditions to estimate expected credit losses with greater accuracy. Under the reasonable and supportable information CECL model, institutions supplement historical trends with forward-looking macroeconomic assumptions and expected prepayments to better capture potential credit losses over the life of the financial asset. Many organizations also use losses using PD, LGD, and EAD methodologies supported by a growing number of credit impairment models, allowing them to continually manage their credit risk as borrower credit quality changes.
Probability of Default (PD)
The Probability of Default represents the likelihood that a borrower will default within a specific timeframe. For Stage 1 assets, a 12-month PD is used; for Stage 2 and Stage 3, a lifetime PD is applied.
PD estimates must be: - Based on historical default data calibrated to current conditions - Adjusted for forward-looking macroeconomic information - Applied at the individual borrower or segment level
Common inputs include credit bureau scores, internal rating models, loan-to-value ratios, and industry-specific risk indicators.
Loss Given Default (LGD)
Loss Given Default measures the proportion of the exposure that the institution expects to lose if a borrower defaults, after accounting for recoveries, collateral, and workout costs.
Key factors influencing LGD include: - Collateral type, quality, and enforceability - Seniority of the debt in the capital structure - Historical recovery rates by portfolio segment - Time value of money (recoveries realized years after default must be discounted)
LGD is typically expressed as a percentage, ranging from near zero (for well-secured loans) to nearly 100% (for unsecured consumer credit).
Exposure at Default (EAD)
Exposure at Default represents the total financial exposure the institution faces at the moment a borrower defaults. For a fixed-rate term loan, this is relatively straightforward, essentially the outstanding balance. For revolving facilities like credit cards or credit lines, EAD is more complex because undrawn commitments may be drawn down prior to default.
EAD calculations typically incorporate: - Current outstanding balance - Credit conversion factors (CCF) for undrawn facilities - Expected repayments and drawdowns over the projection period
Bringing It Together: The ECL Formula
At its simplest, expected credit loss is expressed as:
ECL = PD × LGD × EAD × Discount Factor
However, in practice, this calculation is far more nuanced. It must be:
- Applied across multiple time periods (monthly or quarterly buckets)
- Weighted by probability-weighted scenarios (incorporating macroeconomic forecasts such as GDP growth, unemployment rates, and interest rate projections)
- Discounted at the effective interest rate of the asset
- Aggregated across the entire portfolio
Forward-Looking Information and Macroeconomic Scenarios
One of the most technically demanding aspects of expected credit loss modeling under IFRS 9 is the incorporation of forward-looking information (FLI). The standard explicitly requires institutions to consider future economic conditions, not just rely on historical averages.
Multiple Economic Scenarios
Best practice involves constructing at least three macroeconomic scenarios:
- Base case: The most probable economic outcome
- Upside scenario: A more favorable economic trajectory
- Downside scenario: A stressed or adverse economic environment
Each scenario is assigned a probability weight, and ECL is calculated for each. The final ECL is a probability-weighted average of outcomes across all scenarios. This approach prevents under-provisioning in benign environments while also avoiding excessive volatility.
Key Macroeconomic Variables
Common macroeconomic drivers used to adjust PD and LGD estimates include:
- GDP growth rates
- Unemployment rates
- Interest rate movements
- Property price indices (particularly for mortgage portfolios)
- Sector-specific indicators (commodity prices for energy sector loans, etc.)
The selection of relevant variables and the econometric models linking them to credit risk parameters require significant expertise and validation.
Practical Challenges in ECL Implementation
Despite the conceptual clarity of the expected credit loss framework, its practical implementation is notoriously complex. Institutions regularly cite several recurring pain points.
Data Quality and Availability
ECL models are only as good as the data underpinning them. Problems commonly encountered include:
- Incomplete or inconsistent historical default data
- Insufficient loan-level granularity for segmentation
- Poor data lineage and audit trails
- Challenges integrating data from multiple legacy systems
Building robust data governance frameworks is a prerequisite for credible ECL estimation.
Defining “Significant Increase in Credit Risk”
The SICI trigger for Stage 2 transfers is inherently judgmental. Too conservative a threshold can result in excessive provision volatility; too lenient a threshold may delay recognition of deteriorating credit quality, drawing regulatory criticism. Institutions must document their rationale carefully and apply their criteria consistently.
Model Risk and Validation
ECL models incorporate multiple layers of estimation—PD models, LGD models, EAD models, and macro-scenario frameworks. Each introduces model risk. Robust model governance should include:
- Independent model validation
- Regular backtesting against actual loss experience
- Sensitivity analysis and stress testing
- Clear escalation procedures when model performance deteriorates
Provision Volatility
Because ECL is inherently forward-looking, provisions can increase sharply during economic downturns, even before actual defaults materialize. This procyclicality has been a concern among regulators and standard-setters. Institutions must balance accounting compliance with internal capital planning and stakeholder communication.
ECL for Different Asset Classes
The expected credit loss methodology applies across a wide range of financial instruments, but its application varies significantly by asset class.
Measuring Expected Credit Losses Across Different Asset Types
Applying the CECL and IFRS 9 frameworks requires institutions to estimate credit losses on financial instruments based on the specific characteristics of each portfolio. Whether dealing with loans, debt securities, trade receivables, or off-balance-sheet credit exposures, institutions must estimate lifetime expected credit losses by considering the life of a financial asset, expected cash flows, and the likelihood of default. For financial assets measured at amortized cost and other assets measured at amortized cost, the impairment calculation is based on the asset’s amortized cost basis, ensuring that the allowance for credit losses reflects the amount expected to be collected over the contractual life of a financial instrument. This comprehensive approach supports the timely recognition of credit losses and provides a more realistic view of potential portfolio performance.
Retail Mortgages
Mortgage portfolios typically use loan-to-value (LTV) ratios as a key risk driver. Property price forecasts are central to both PD and LGD estimation. Collateral valuation models and indexation approaches require careful calibration.
Consumer Credit and Credit Cards
Revolving credit products present unique challenges for EAD modeling due to uncertain drawdown patterns. Behavioural scoring models and payment rate assumptions are critical inputs. Lifetime for credit cards is often defined using behavioral maturity assumptions rather than contractual terms.
Corporate and SME Lending
Corporate credit typically relies on internal credit ratings and financial statement analysis. Point-in-time PD estimates are often derived from through-the-cycle rating systems using macroeconomic overlays. Covenant analysis and sector concentration risk are additional considerations.
Trade Receivables and Contract Assets
For trade receivables, IFRS 9 permits a simplified approach using provision matrices—grouping receivables by days past due and applying historical loss rates adjusted for forward-looking factors. This is particularly useful for entities outside the financial sector.
ECL Disclosure and Reporting Requirements
IFRS 9 imposes extensive disclosure requirements designed to provide users of financial statements with insight into how institutions manage credit risk and estimate ECL.
Quantitative Disclosures
Institutions are required to disclose:
- A reconciliation of the opening and closing loss allowance by stage
- Gross carrying amounts by credit risk grade and stage
- Write-offs and recoveries during the period
- Concentration of credit risk exposures
Qualitative Disclosures
Beyond the numbers, institutions must explain:
- The methodologies and key assumptions underlying ECL models
- How forward-looking information is incorporated
- The definition of default and the SICI threshold applied
- Sensitivity of ECL estimates to changes in key assumptions
Regulators and auditors scrutinize these disclosures closely. Clear, consistent, and transparent reporting is not only a compliance obligation, it is increasingly a market expectation.
IFRS 9 vs. CECL: Key Differences
While both IFRS 9 and CECL share the expected credit loss philosophy, practitioners operating across jurisdictions must understand their differences.
| Feature | IFRS 9 | CECL (ASC 326) |
|---|---|---|
| Scope of lifetime ECL | Stages 2 & 3 only | All assets from day one |
| Time horizon at origination | 12-month ECL (Stage 1) | Full lifetime ECL |
| Scenario requirement | Multiple probability-weighted scenarios | Reasonable and supportable forecasts |
| Interest revenue (Stage 3) | On net carrying amount | On amortized cost basis |
| Simplified approach | Available for trade receivables | Available for certain short-term assets |
The most significant practical difference is that CECL requires full lifetime provisioning from origination, which generally results in higher Day 1 provisions compared to IFRS 9.
From Incurred Loss to Lifetime Credit Loss Recognition
One of the primary objectives of the CECL model is to improve transparency by requiring institutions to recognise credit losses much earlier than the previous incurred loss approach. Unlike the incurred loss model, which relied on waiting for a loss event before recording impairment, CECL requires organizations to recognize an allowance for expected losses from initial recognition. This means entities must recognize an allowance for lifetime expected losses, or an allowance for lifetime expected credit losses where required, covering credit losses over the life of the exposure. IFRS 9 follows a different methodology through its three-stage model, where stages 2 and 3 require recognition of lifetime expected credit losses after a significant increase in credit risk, while Stage 1 applies a 12-month expected loss approach.
How Technology Is Transforming ECL Compliance
The complexity of expected credit loss calculations, spanning large datasets, multiple models, scenario simulations, and extensive disclosures, makes automation not just helpful but essential for many institutions.
The Limitations of Spreadsheet-Based ECL
Many smaller institutions and corporate treasuries initially attempted to manage ECL in spreadsheets. While workable for very simple portfolios, this approach quickly breaks down due to:
- Version control failures across large workbooks
- Inability to handle thousands of loan-level records efficiently
- Poor audit trails and difficulty demonstrating model governance
- Time-intensive manual updates when assumptions change
Purpose-Built ECL Software
Modern ECL platforms address these limitations by offering:
- Automated data ingestion from core banking, CRM, and GL systems
- Configurable staging engines that apply institution-specific SICI criteria
- Integrated PD, LGD, and EAD model libraries
- Built-in macro-scenario management with probability-weighting tools
- Automated journal entry generation and disclosure support
- Audit trails and version control for regulatory submissions
Platforms like Finflexia are designed specifically to help financial institutions and corporate finance teams manage this complexity—combining flexibility with the rigor that regulators expect.
Benefits of Automated ECL Solutions
The business case for investing in purpose-built ECL software is compelling:
- Reduced cycle time: Automated processes can compress monthly ECL runs from weeks to hours
- Improved accuracy: Elimination of manual formula errors and copy-paste mistakes
- Scalability: Ability to handle portfolio growth without proportional increases in analyst headcount
- Scenario agility: Rapid re-running of scenarios during stress testing or regulatory reviews
- Regulatory confidence: Clean, documented audit trails that withstand external scrutiny
Best Practices for ECL Model Governance
Regardless of the methodology or technology used, strong model governance is the foundation of a credible ECL program.
Documentation Standards
Every assumption, parameter choice, and override should be documented, including:
- The rationale for segmentation decisions
- The basis for macroeconomic scenario selection and probability weights
- Management overlay justifications
- Any deviations from standard model outputs
Regular Backtesting and Calibration
ECL models should be backtested at least annually, comparing predicted losses against actual defaults and recoveries. Where material gaps exist, models should be recalibrated. An honest assessment of model performance is both a regulatory expectation and a business imperative.
Cross-Functional Governance
Effective ECL governance requires collaboration across:
- Finance and accounting (for reporting and disclosure)
- Risk management (for model development and validation)
- IT and data management (for data infrastructure and controls)
- Internal audit (for independent challenge)
- Senior management and the board (for oversight and approval)
The Future of Expected Credit Loss
The expected credit loss landscape continues to evolve. Several emerging trends are worth monitoring.
Artificial Intelligence and Machine Learning
Traditional ECL models rely heavily on regression-based statistical approaches. Increasingly, institutions are exploring machine learning techniques, including gradient boosting, neural networks, and natural language processing, to improve PD, LGD, and EAD predictions. While these approaches can improve accuracy, they introduce additional model interpretability and validation challenges.
Climate Risk Integration
Regulatory bodies including the Bank of England, ECB, and others are increasingly expecting institutions to integrate climate-related financial risks into their credit risk frameworks. This includes assessing how physical risks (flooding, extreme weather) and transition risks (carbon pricing, stranded assets) affect borrower creditworthiness and collateral values, ultimately feeding into ECL estimates.
Real-Time Credit Risk Monitoring
As data availability improves, through open banking, transaction monitoring, and alternative data sources, institutions are beginning to explore near-real-time credit risk assessment. This could support more dynamic staging decisions and earlier identification of deteriorating exposures, enhancing both risk management and accounting accuracy.
Conclusion
Expected credit loss is more than an accounting standard, it is a philosophy of proactive, transparent, and forward-looking risk management. By requiring institutions to recognize the possibility of loss from the moment a financial instrument is created, IFRS 9 and CECL have fundamentally improved the quality of financial reporting and the resilience of the global financial system.
Yet the complexity of ECL implementation remains significant. Success requires high-quality data, robust models, sound governance, and increasingly, purpose-built technology to manage the computational and reporting burden at scale.
Whether you are an established bank refining your ECL methodology, a mid-sized lender building your first compliant model, or a corporate treasury seeking to apply the simplified approach to trade receivables, the journey toward ECL excellence is continuous. Staying current with regulatory guidance, investing in the right tools, and embedding a culture of credit risk discipline are the cornerstones of sustainable compliance.
To explore how Finflexia can support your expected credit loss workflow, from data ingestion to disclosure-ready reporting, visit finflexia.app .

Written by
Dominik KonoldFounder
Dominik is the founder of Finflexia and an expert in treasury accounting, financial instrument valuation and IFRS compliance. Since 2016, he's been a certified Professional Risk Manager (PRMIA) and also lectures for the Association of Public Banks and the Academy of International Accounting. He built Finflexia to help treasury teams automate complex accounting workflows.
Related Posts
Debit Valuation Adjustment (DVA): Understanding Valuation Adjustments
This comprehensive guide explains debit valuation adjustments (DVA), valuation adjustments, credit risk, CVA, derivative pricing, and practical risk management strategies for financial institutions.
Hedge Effectiveness: How to Measure & Improve It
A practical overview of hedge effectiveness, covering testing methods, hedge types, accounting standards, common challenges, and strategies for maintaining effective risk protection.
What Is CVA? Understanding Credit Valuation Adjustment and Counterparty Risk
This guide explains how Credit Valuation Adjustment (CVA) prices, hedges, and regulates the risk that a derivatives counterparty defaults.
Ready to simplify your treasury accounting?
See how Finflexia helps you manage financial instruments with ease. Book a demo to learn more.
Book a Demo